Making Your Own Python Package Publicly Available

In this post, I document the full procedure for turning a personal Python project into a public package, available on both GitHub and the Python Package Index (PyPI).

As a demonstration, I create a small package named PalAniSh (Palette of Animation of Shanghai), which extracts and displays color palettes from classical Chinese animations produced by the Shanghai Animation Film Studio.

1. Color Palette generation

Herein, I will use some of the screenshots from the Chinese traditional animations, e.g., the 1956 animation _The Proud General (骄傲的将军). All raw images as source of color palette were derived from Bilibili.

The extraction and combination of colors were similar to the web-based tool Adobe color or Colormind (http://colormind.io/image).

Below is the core workflow:

1
2
3
4
5
6
7
8
9
10
11
12
13
14
15
16
17
18
19
20
21
22
23
24
25
26
27
28
29
30
31
32
33
34
35
36
37
38
39
40
41
42
43
44
45
46
47
48
49
50
51
52
53
54
55
56
57
58
59
60
61
62
63
64
65
66
67
68
69
70
71
72
73
74
75
76
77
78
79
80
81
82
83
84
from PIL import Image
import matplotlib as mpl
from matplotlib.offsetbox import OffsetImage, AnnotationBbox
from matplotlib.colors import ListedColormap

import cv2
import extcolors
from colormap import rgb2hex,hex2rgb
import colorsys

def get_hsv(hexrgb):
hexrgb = hexrgb.lstrip("#") # in case you have Web color specs
r, g, b = (int(hexrgb[i:i+2], 16) / 255.0 for i in np.arange(0,5,2))
return colorsys.rgb_to_hsv(r, g, b)
def get_hls(hexrgb):
hexrgb = hexrgb.lstrip("#") # in case you have Web color specs
r, g, b = (int(hexrgb[i:i+2], 16) / 255.0 for i in np.arange(0,5,2))
return colorsys.rgb_to_hls(r, g, b)

### HSV sorting
def get_sorted_df_color(input_color,sort_type):
input_ = input_color
colors_pre_list = str(input_).replace('([(','').split(', (')[0:-1]
df_rgb = [i.split('), ')[0] + ')' for i in colors_pre_list]

df_percent = [i.split('), ')[1].replace(')','') for i in colors_pre_list]
df_color_up = [rgb2hex(int(i.split(", ")[0].replace("(","")),
int(i.split(", ")[1]),
int(i.split(", ")[2].replace(")",""))) for i in df_rgb]

df_color_up_new = df_color_up.copy()
if sort_type == 'hsv':
df_color_up_new.sort(key = get_hsv)
if sort_type == 'hls':
df_color_up_new.sort(key = get_hls)
df_color_up_new = df_color_up_new[::-1]
if "#FFFFFF" in df_color_up_new:
df_color_up_new.insert(0, "#FFFFFF")
df_color_up_new = df_color_up_new[0:-1]
re_index = [df_color_up.index(c) for c in df_color_up_new]
df_percent_new = [df_percent[i] for i in re_index]
df = pd.DataFrame(zip(df_color_up_new, df_percent_new), columns = ['hsv_code','occurence'])
if sort_type == 'none':
df = pd.DataFrame(zip(df_color_up, df_percent), columns = ['hsv_code','occurence'])
df['rgb_color'] = [[hex2rgb(c)[0]/255.0,hex2rgb(c)[1]/255.0,hex2rgb(c)[2]/255.0,] for c in df['hsv_code']]

return df

def get_color_x(input_name,tol,num):
output_width = 200 #set the output size
img = Image.open(input_name)
wpercent = (output_width/float(img.size[0]))
hsize = int((float(img.size[1])*float(wpercent)))
img = img.resize((output_width,hsize), Image.ANTIALIAS)

# 1. Show the resized image
resize_name = './resize_' + 'test_.png'#the resized image name
img.save(resize_name)
img_url = resize_name
colors_x = extcolors.extract_from_path(img_url, tolerance=tol, limit = num)
return colors_x

# plot the result color palatte
def plot_image_with_color_palette(df_color,input_name,palatee_name,axs):

img_url = input_name
img = plt.imread(img_url)
axs[0].imshow(img)
axs[0].axis('off')

name = palatee_name
color_list = df_color['rgb_color'].values
color_name = df_color['hsv_code'].values
cmap_diy = ListedColormap(color_list, name)
col_map = cmap_diy
new_val = []
ticks = np.linspace(0.0,1, len(color_list)+1)
for i in range(0,len(ticks)-1,1):
new_val.append((ticks[i]+ticks[i+1])/2.0)
cbar = mpl.colorbar.ColorbarBase(axs[1], cmap=col_map, orientation = 'horizontal', ticks =new_val, alpha = 0.75)
cbar.ax.set_xticklabels(color_name, fontsize =10, rotation = 30)

ttl = plt.title(name,fontweight="bold",fontsize =16,)
ttl.set_position([.5, 1.15])

Example output

1
2
3
4
5
input_name = './SA_palette/九色鹿/九色鹿9.jpg'
colors_x = get_color_x(input_name,10,10)
df_color_jsl = get_sorted_df_color(colors_x,'hsl')
fig, axs = plt.subplots(2,1,figsize=(6,5), gridspec_kw={'height_ratios': [5, 1]})
plot_image_with_color_palette(df_color_jsl,input_name,'A Deer of Nine Colors', axs)

alt text

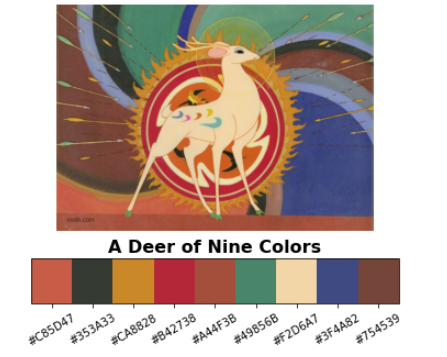
Other examples are shown as follows

enter image description here

enter image description here

enter image description here

2. Packaging the Code and Uploading to GitHub

Usually, a package will have such structure:

1
2
3
4
5
6
7
8
9
10
palanish/
├── palanish/ # main folder
│ ├── __init__.py # essential even it is empty. With this file included, Python treats the folder as a package.
│ └── color_extractor.py # main functions
├── tests/ # optional
│ └── test_basic.py
├── README.md
├── LICENSE
├── setup.py
└── requirements.txt

First step, add the folder of palanish as previous listed and add the main function into the color_extractor.py.

Later, within the __init__.py, add following line:

1
from .color_extractor import get_color_palette, hex_sort

Then, write the script of the setup.py as follows:

1
2
3
4
5
6
7
8
9
10
11
12
13
14
15
16
17
18
19
20
21
22
23
24
from setuptools import setup, find_packages

setup(
name='palanish',
version='0.1.0',
description='Palette extraction from Shanghai Animation images',
author='Yufang Hao',
author_email='your_email@example.com',
url='https://github.com/envhyf/palanish',
packages=find_packages(),
install_requires=[
'pillow',
'extcolors',
'matplotlib',
'colormap',
'pandas'
],
classifiers=[
'Programming Language :: Python :: 3',
'License :: OSI Approved :: MIT License',
],
python_requires='>=3.6',
)

As well as writing a small README.md,

1
2
3
4
5
6
7
8
9
10
11
12
13
14
15
16
17
18
19
20
21
22
# PalAniSh
Extract and visualize color palettes from classic Shanghai animations or any screenshots.

## Installation
pip install git+https://github.com/envhyf/palanish.git

## Usage

```python
from palanish import get_color_palette
colors = get_color_palette("screenshot.jpg")

### 🔑 4. `LICENSE`

You can use [MIT License](https://choosealicense.com/licenses/mit/) for open source:

```txt
MIT License

Copyright (c) 2024 Yufang Hao
Permission is hereby granted, free of charge, ...

The final step is uploading to Github

1
2
3
4
5
6
7
cd palanish
git init
git add .
git commit -m "Initial commit"
git branch -M main
git remote add origin git@github.com:envhyf/palanish.git
git push -u origin main

After all steps done, anyone can install via:

1
pip install git+https://github.com/envhyf/palanish.git

3. Web app

With

Create your first web app: Interactive data panel for visualizatoin correlations The work transformed from shapefile to geojson file

Comments

Your browser is out-of-date!

Update your browser to view this website correctly. Update my browser now

×