With ultra-high resolution Orbitrap MS1 scan, I already obtain highly accurate chemical formulae. However, chemical information are still not enough.
First, each formula may correspond to multiple isomeric structures, and each isomer can carry unique information,such as its special emitters, formation pathways, or toxicity.
Even worse, some ions share nearly identical m/z values under the fitting threshold (20 ppm tolerance)but correspond to entirely different molecular formule.
1 | m/z 261.12288 → C14H17N2O3 ↔ C12H18N2NaO3 |
If we apply MS² analysis, we can go beyond the limitations of MS1. In this process, a specific parent ion is first isolated in the quadrupole. Only this ion (actually also co-isolated ions in the same window) is allowed to pass through to the next stage, where it enters the collision cell and collide with N2 gas.
The resulting fragment ions, which carry structural information about the parent ion, are then introduced into the Orbitrap for high-resolution detection. These fragments provide rich m/z information, often linked to the presence or loss of specific functional groups, making the spectrum highly informative.
By analyzing these MS2 spectra, either through in silico computational tools or by matching against curated spectral libraries, we can narrow down the structural identity of the parent ion. This capability is not only just valuable in environmental science but also has broad and profound applications in other fields. For example, in medical research, it is widely used for the structural identification of metabolites, disease diagnostics biomarker discovery (an interesting link). In food chemistry, it enables the profiling of bioactive compounds and nutritional components.
1. MS2 strategy knowledge base
Generally, there are two types of MS² (tandem mass spectrometry) acquisition strategies that can be adopted:
DDA – Data-Dependent Acquisition
In this approach, precursor ions are selected based on the MS1 signal intensity. The instrument automatically selects the top N most intense precursor ions (above a certain threshold) for fragmentation in MS2 (MS/MS).✅ Advantage: High-abundance ions usually yield high-quality MS2 spectra, making structural interpretation more reliable.
⚠️ Limitation: Low-abundance ions may be missed, which is especially problematic in environmental samples like mine, where many of the most intense signals originate from background contaminants rather than meaningful analytes.DIA – Data-Independent Acquisition
In DIA, all ions within predefined m/z windows are fragmented simultaneously, regardless of their intensity.✅ Advantage: Provides broader MS2 coverage, ensuring that even low-abundance compounds are captured.
⚠️ Limitation: The resulting MS2 spectra are highly complex and often require advanced deconvolution algorithms to interpret.
In my case, I will first work with MS1 full-scan mode, using post-acquisition data analysis to identify and narrow down a list of important precursor ions across different m/z windows. Based on this information, I will then apply a targeted Selected Ion Monitoring (SIM) method focused on these specific ions. For each target, I will optimize key acquisition parameters with the goal of obtaining reproducible, stable, and chemically meaningful fragment patterns for downstream structural interpretation.
From the paper of Assress et al (2023), I summarize the important paramters used for MS2 DIA analysis
| Parameter | Description & Role | Tuning Range | Optimal Setting | Notes |
|---|---|---|---|---|
| MS2 Resolution | For MS/MS spectra quality | 30k–120k | 30k | Higher resolution MS/MS = fewer scans due to slower cycle |
| RF Lens (%) | Focuses ions before analysis | 10–100% | 70% | Balance between signal intensity and ion transmission |
| Mass Isolation Width | m/z window for selecting precursors | 0.4–6.0 | 2.0 m/z | Narrow windows increase purity but reduce sensitivity |
| Intensity Threshold | Min signal to trigger MS/MS | 1e3–1e8 | 1e4 | Lower thresholds = more spectra, but lower quality |
| TopN (MS/MS Events) | Max MS/MS per cycle | 5–20 | Top 10 | More MS/MS = more compounds, but slower scans |
| Cycle Time (s) | Max time per scan loop | 1–7 s | 1 s | Shorter = better chromatographic peak sampling |
| AGC Target | Target ion count (MS/MS) | 50–500% | 100% | Prevents overfilling or low ion count |
| MIT (MS2) (ms) | For MS/MS scans | 50–300 ms | 50 ms | Longer MIT slows scan speed |
| Microscans | Number of averaged scans | 1–10 | 1 | Higher = better S/N, but much slower cycle |
| Collision Energy | For ion fragmentation | Fixed/Stepped | Stepped: 10 & 40 V | Stepped energies improve MS/MS spectrum richness |
| Dynamic Exclusion | Prevents redundant fragmentation | 3–100 s | 10 s | Ensures broader MS/MS coverage |
3. Simple MS2-Level Data Visualization
This section presents a basic workflow for parsing and visualizing MS1 and MS2 data exported from Orbitrap. The raw .raw files are first converted into .ms1 and .ms2 formats using tools such as MZmine3 or RawConverter.
Two functions are provided as follows:
1 | def ms1_segment_scan_read(file_path): |
Load MS1 and MS2 data
1 | filename = './raw_data/20250312_tunning/MS2_trial_res30K_HCD20%_MIT1000.ms1' # Adjust to your file path |
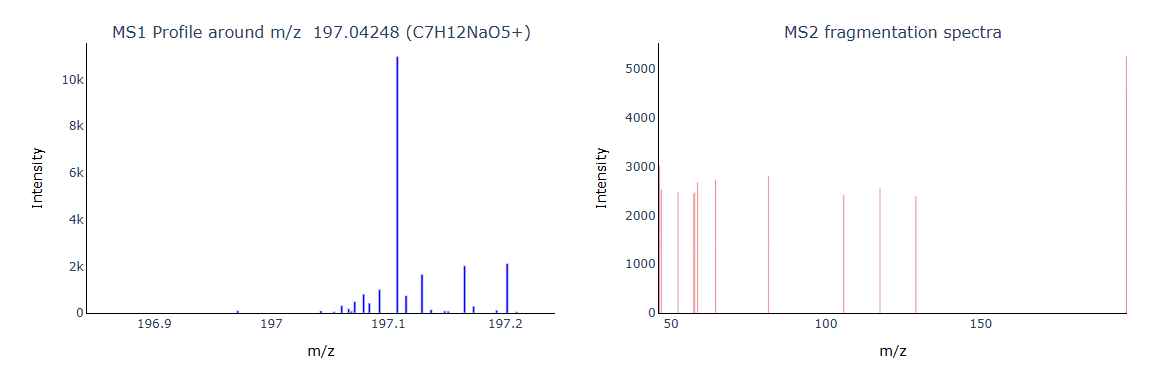
1 | tar_mz = 197.04248 |
Below is an example where the MS1 signal was strong, but the corresponding MS2 spectrum failed to produce meaningful fragments, likely due to poor fragmentation settings or low ion injection efficiency.
4. Tool recommendation for MS2 data processing
4.1 MetFrag
A web-based tool for in-silico fragmentation and metabolite annotation. It is commonly used for identifying small molecules based on MS2 spectra.
4.2 CFM-ID
Another tool for predicting MS2 fragmentation patterns, supporting different collision energies.
Note: The website is often unstable and may be temporarily inaccessible.
4.3 MassBank
Unlike MetFrag and CFM-ID, MassBank provides a searchable database of experimentally acquired MS2 spectra. Users can compare their spectra to community-uploaded reference data under similar experimental conditions.
4.4 MSBuddy
MSBuddy is an open-source, Python-based tool designed for molecular formula assignment with MS/MS (MS2) assistance. It is particularly useful for reducing ambiguity in formula annotation, though it is not intended for structural elucidation.
The tool is simple to use and accepts .mgf files as input. An example worlflow can be seen as follows:
1 | import tarfile # Use standard tarfile instead of backports |
The output shows a successful identification of a likely molecular formula using MS2-assisted annotation:
1 | adduct [M+H]+ |
In this case, MS2 fragments supported C9H10N2 is the most probable formula.
4.5 SIRIUS
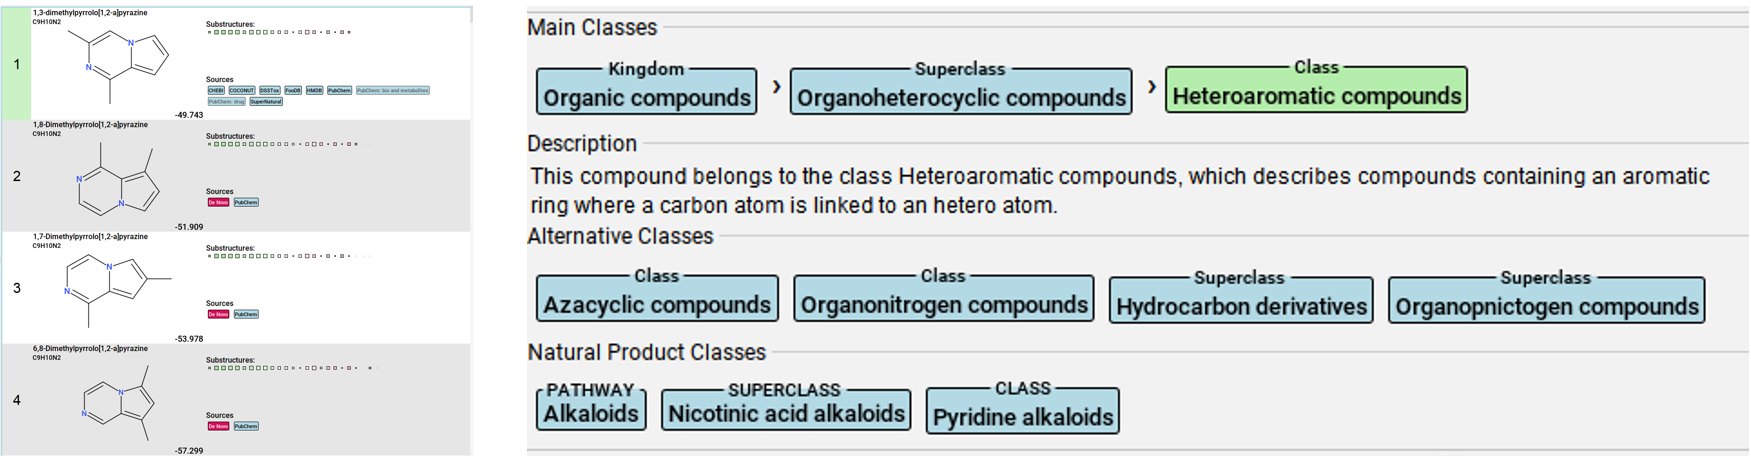
SIRIUS platform is a GUI-based software for analyzing MS2 datasets (It also has command line version which I have not tried yet). SIRIUS combines library matching, in-silico fragmentation, and de novo molecular formula prediction to rank candidate molecular structures based on how well they match observed MS2 fragments.
Below is an example output from my dataset, showcasing the top-ranked structure based on fragment scoring
Reference
Assress, H. A.; Ferruzzi, M. G.; Lan, R. S.
Optimization of Mass Spectrometric Parameters in Data Dependent Acquisition for Untargeted Metabolomics on the Basis of Putative Assignments.
J. Am. Soc. Mass Spectrom. 2023, 34(8), 1621–1631. https://doi.org/10.1021/jasms.3c00084Defossez E, Bourquin J, von Reuss S, et al. Eight key rules for successful data‐dependent acquisition in mass spectrometry‐based metabolomics[J]. Mass Spectrometry Reviews, 2023, 42(1): 131-143. https://analyticalsciencejournals.onlinelibrary.wiley.com/doi/full/10.1002/mas.21715
McEachran, A. D., Balabin, I., Cathey, T., Transue, T. R., Al-Ghoul, H., Grulke, C., … & Williams, A. J. (2019). Linking in silico MS/MS spectra with chemistry data to improve identification of unknowns. Scientific Data, 6(1), 141. https://www.nature.com/articles/s41597-019-0145-z
Xing, S., Shen, S., Xu, B., Li, X., & Huan, T. (2023). BUDDY: molecular formula discovery via bottom-up MS/MS interrogation. Nature Methods, 20(6), 881-890. https://www.nature.com/articles/s41592-023-01850-x
Dührkop, K., Fleischauer, M., Ludwig, M., Aksenov, A. A., Melnik, A. V., Meusel, M., … & Böcker, S. (2019). SIRIUS 4: a rapid tool for turning tandem mass spectra into metabolite structure information. Nature methods, 16(4), 299-302. https://www.nature.com/articles/s41592-019-0344-8
Comments