1
2
3
4
5
6
7
8
9
10
11
12
13
14
15
16
17
18
19
20
21
22
23
24
25
26
27
28
29
30
31
|
import numpy as np
import iris
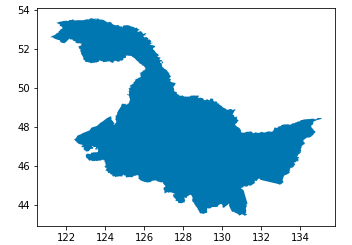
import geopandas as gpd
fname = r'xxx/china.shp'
cn =gpd.read_file(fname)
x0,x1 = cn.bounds['minx'].values,cn.bounds['maxx'].values
y0,y1 = cn.bounds['miny'].values,cn.bounds['maxy'].values
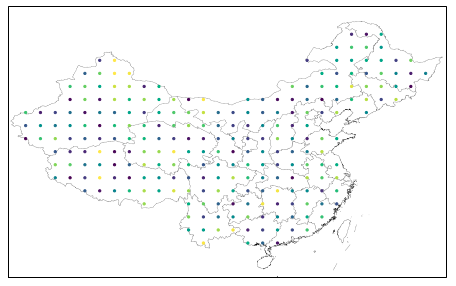
def back_main_clean(fig,extent):
ax = fig.add_subplot(111, projection=ccrs.PlateCarree())
ax.set_extent(extents=extent, crs=ccrs.Geodetic())
for i in ax.spines.itervalues():
i.set_linewidth(0.01)
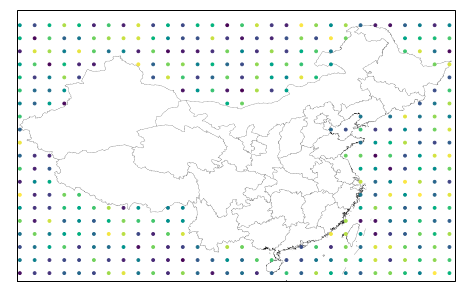
fname = r'xxx/china_provinces.shp'
shape_feature = ShapelyFeature(Reader(fname).geometries(), ccrs.PlateCarree(),facecolor='#FFFFFF', linestyle='--',edgecolor ='k', linewidth = 0.25, alpha =1)
ax.add_feature(shape_feature, zorder =3)
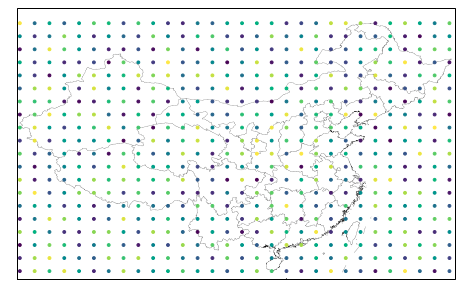
x = np.linspace(x0,x1,30)
y = np.linspace(y0,y1,20)
fig = plt.figure(figsize=(8, 5))
ax = back_main_clean(fig, extent)
xx,yy = np.meshgrid(x,y)
zz = np.random.random((len(x),len(y)))
plt.scatter(xx.reshape(-1),yy.reshape(-1),zorder =4,transform=ccrs.PlateCarree(), c=zz.reshape(-1),s=8)
|

Kommentare